









How to Create an Excel Gantt Chart with Project Online Data + Power BI
Contents

Contents
How to Create an Excel Gantt Chart with Project Online Data + Power BI
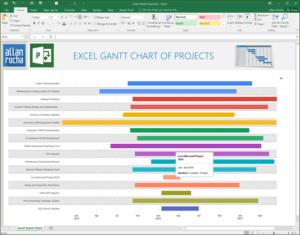
You are not dreaming!
You can easily create a Gantt Chart directly in Excel using a FREE app and also publish it to Power BI!
We will need:
- Project Online account
- Projects data
- Excel 2013 or 2016
- Gantt Chart for Excel App
Let’s create our Gantt Chart of projects from Project Online and publish it to Power BI.
- Open Excel
- Create a New Query – From Other Sources – From OData Feed
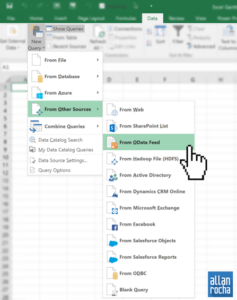
- Use your Project Online OData Feed URL

- Select on the Projects table
- Click on Edit
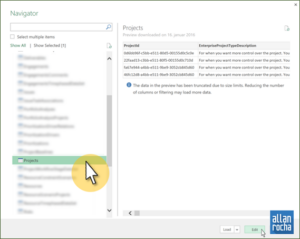
- Select at least the following fields:
- – ProjectName
- – ProjectStartDate
- – ProjectFinishDate
- Click on Close & Load
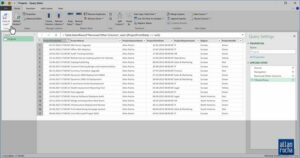
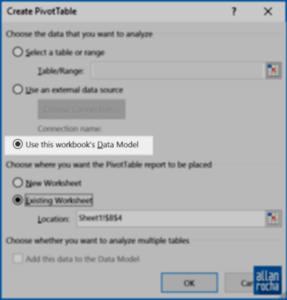
- Insert a New PivotTable using the workbook’s Data Model
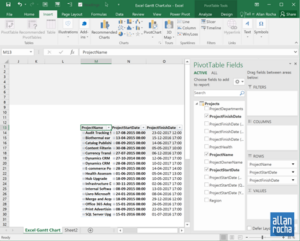
- Add our columns in the following order
- – ProjectName
- – ProjectStartDate
- – ProjectFinishDate
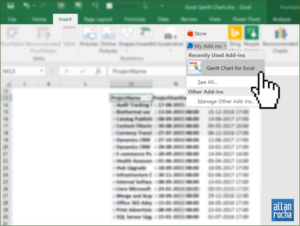
- Add the Office App “Gantt Chart for Excel” under the Insert tab, My Add-ins button
- In case you don’t have it already, just install it from the Store in See All
- Create your layout
- Then click on “Select Table“
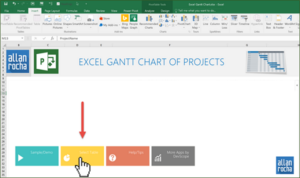
- Select the range table
- Click on OK.
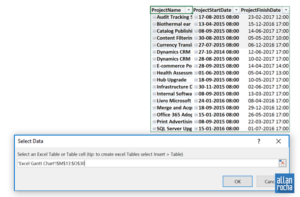
- And that is it!

- You have now a cool Gantt Chart in Excel showing Project Online data
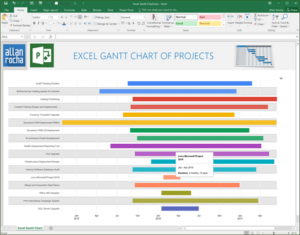
- Upload your file to OneDrive or SharePoint
- Now you can access it directly in the browser!
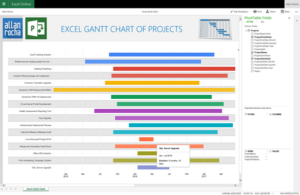
You can also import it into Power BI
- You can also import it into Power BI
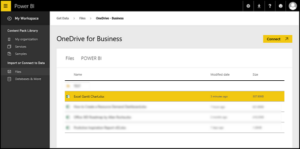
- That is our Gantt Chart in Power BI
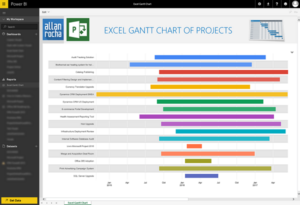
Hope you like it!
About the Author
Allan Rocha has dedicated his entire career to project management. For about 12 years working with implementations of the Microsoft PPM Solution. At the age of 21 years he founded his own company, Sotis Consulting. In July 2010 was nominated Microsoft Project MVP (Most Valuable Professional).

Tags
Excel
Gantt Chart
Power BI
Project online
trending posts